
A query plan for spreadsheets
For an Excel or CSV file, the agent writes the query as filters and calculations. AI-Flow checks every column name against the file before it runs the plan.
The agent turns a question about figures into a query on your Excel file or database. AI-Flow runs the query on the data, and the agent answers with the numbers and a chart.
AI-Flow calculates totals and averages from the file or the database. The agent writes the question as a query and explains the result.
The agent sends one query to the sales workbook. AI-Flow adds up 108 rows by region and quarter, and the agent draws the result as a line chart.
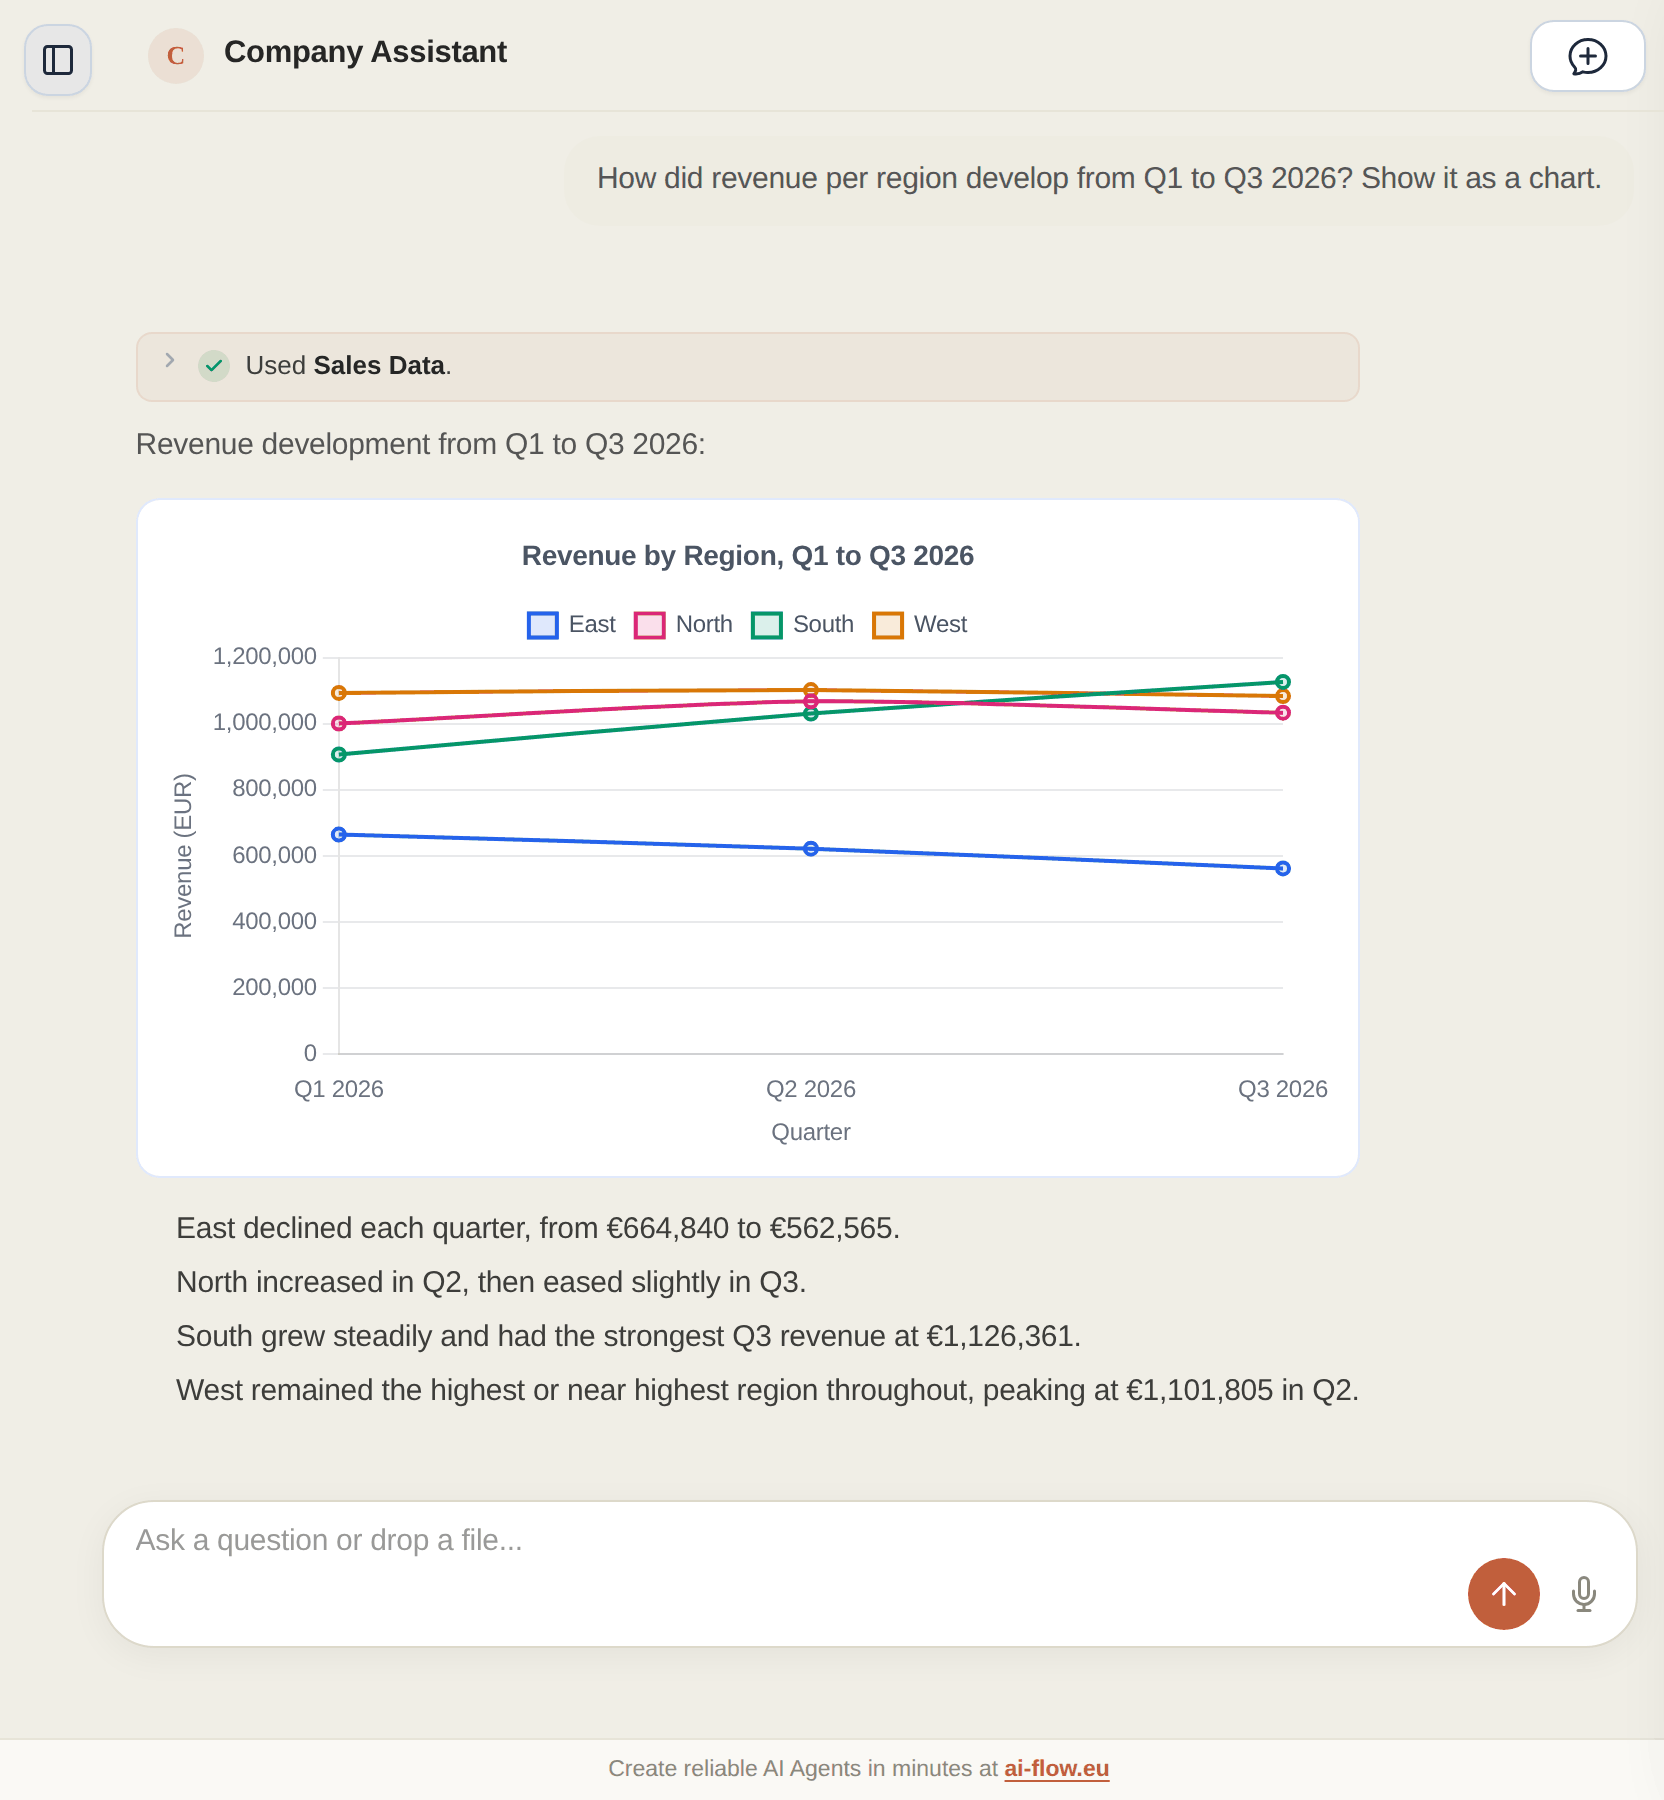
AI-Flow calculates on the data itself and gives the agent the result to explain.
For an Excel or CSV file, the agent writes the query as filters and calculations. AI-Flow checks every column name against the file before it runs the plan.
AI-Flow reads each workbook once and notes its sheets, header rows, tables and column types. The agent gets that overview with every question.
Connect PostgreSQL, MySQL or Microsoft SQL Server. AI-Flow reads the table structure and writes SQL for each question. If the database reports an error, AI-Flow corrects the query once.
REST APIs with an OpenAPI description work as data sources too, and so do Google Sheets and Excel files in OneDrive.
The agent can draw bar, line, pie and scatter charts, box plots and heat maps. A chart is plain data, so no code from the model runs in the browser.
Give one agent a knowledge base and a data source. It can then answer with the return figures for region East and the section of the returns policy about them.
These settings exist in the app today.
You can check how the agent got each number.
You set access per agent, and AI-Flow logs every run.
Upload a workbook your team works with every week, ask the questions you usually answer by hand and compare the figures.
Questions about policies and manuals? See Agentic RAG

